Introduction to data analysis
Intro to data analysis
Data analysis - a process of inspecting, cleansing, transforming, and modeling data with the purpose of discovering useful information, suggesting conclusions, and supporting decision-making. Data analysis has multiple facets and approaches, encompassing diverse techniques under a variety of names, in different business, science, and social science domains.
Working with data
Data - is a set of values of qualitative or quantitative variables. Data is measured, collected and reported, and analyzed, whereupon it can be visuzlised using graphs, images and other analisys tools. Data is obtained as a result of measurements.
Scales of measurement refer to ways in which variables/numbers are definedand categorized. Each scale of measurement has certain properties which in turn determines the appropriateness for use of certain statistical analyses.
There are 4 scales of measurement:
- Nominal - categorical data and numbers that are simply used as identifiers or names represent a nominal scale of measurement. For example, number of your group is a nominal data. Also, in case of definition of variables: male as 1 and female as 0 or visa versa, data can be used as categories of data.
- Ordinal - an ordinal scale of measurement represents an ordered series of relationships or rank order. For instance, first, second and third places in any contest represent ordinary data. Also list of applicants for fellowship define an ordinal scale.
- Interval - a scale which is quantity and has equal units but for which zero represents simply an additional point of measurement is an interval. The Fahrenheit scale is a clear example of the interval of measurement. Thus, -10 degrees Fahrenheit are interval data. With each of these scales there is direct, measurable quantity with equality of units. In addition, zero does not represent the the absolute lowest value. Rather, it is point on the scale with numbers both above and below it.
- Ratio - the ratio scale of measurement is similar to the interval scale in that it also represents quantity and has equality of units.
There is a table, which show difference between scales:

A variable is a quantity that has changing values. Variables are devided on discrete and continuous. And what is the difference between them?
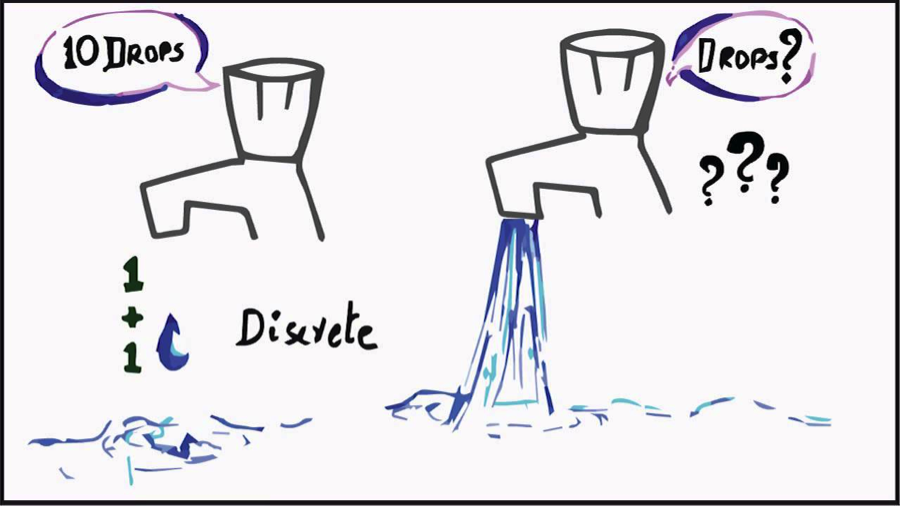
A discrete variable (count data) is a variable that can only take on a certain number of values. In other words, they do not have an infinite number of values. If you can count a set of items, then it's a discrete variable. The opposite of a discrete variable is a continuous variable. Continuous variables can take on an infinite number of possibilities.
A continuous variable (continuous data) is a variable that has an infinite number of possible values. In other words, any value is possible for the variable.
Difference between variables: good example to explain difference is age. You can’t count it. Why not? Because it would literally take forever. For instance: we can count years, months, days, hours, seconds, milliseconds, nanoseconds, picosends…and so on. You could turn age into a discrete variable and then you could count it, as person's age in years/months. Or water: we can count drops of water, which is discrete data, but water flow is uncountable - continuous data.

Stages to solve problems of data analysis
Problem statement - the defining stage on which entire analysis progress depends.defining stage on which the entire analysis progress depends - begins with the stage of formulating the purpose of whole research, for achievement of which data was collected and processed. Basing on purpose, list of necessary data is determined.
One of the typical mistakes of researchers is that data is first collected, and then the processing tasks are formulated. Pre-collected data can reflect quite different characteristics, rather than those that are important to the purpose.
A typical form for data collection is the "object-attribute" table, in which the values of characteristics (properties) characterizing each object under study are recorded. Objects - "people", "products", "services", etc. Examples of attribute may be "weight", "length", "color", "profession", "gender", etc. A table of this type is usually called a table of experimental data (TED).

Data collection - is the process of gathering and measuring information on targeted variables in an established systematic fashion, which then enables one to answer relevant questions and evaluate outcomes.
At the selection stage, a software package or data analysis system is selected. Factors affecting the choice of means: the amount of data, the number of objects and characteristics, types of characteristics, types of computers available, user qualifications.
At the stage of formalization of the collected TED data should be given the form required by the input data chosen by the user of the automated data analysis system. The result is a formalized TED, ready to input into the system.
The second stage of the analysis is that the data is first input into the computer, where they save in the data archive, and then all or part of the data is selected from the archive, after which only the process (but this is beyond second stage) traditionally called processing.
In the data archive due to special programs-editors, input data is checked and errors are corrected. The processing task specifies the size of the TED, the data storage location, the types of characteristics in the TED, the type of the task to be solved, the print mode of the results, etc.
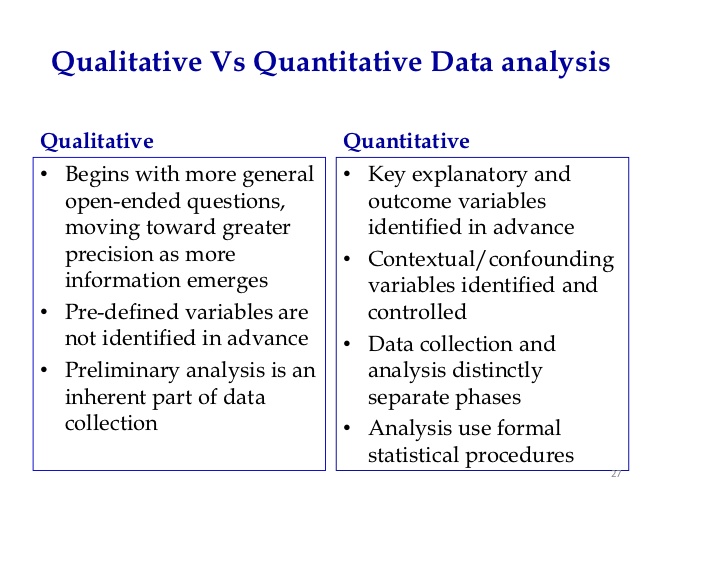
Data analysis at the qualitative level - is an attempt to present the collected data in visual form, with the aim: to see their suitability for checking formed hypotheses or achieving the purpose.
Qualitative Data Analysis (QDA) - is the range of processes and procedures whereby we move from the qualitative data that have been collected into some form of explanation, understanding or interpretation of the people and situations we are investigating. The idea is to examine the meaningful and symbolic content of qualitative data.

The representation of data on a numerical axis is called the projection of data on a characteristic. The same feature can be depicted by dividing the entire range of its values into a number of intervals, which are a histogram of objects by feature.
Main tasks in qualitative analysis:
- Economical, or informative, description of data. Substantial statement of the problem: to find a small number of the most important properties (characteristics, features) of the studied object. Formal problem statement is to eliminate duplicate characteristics or to find (construct) new features (a smaller number) that describe the data.
- Grouping (classification) of objects. Substantial statement: among the set of studied objects, find groups with similar properties. Formal statement: to find compact distributions of points in the space of description.
- Investigation of the dependence of one characteristic on the others (description of the target attribute). Substantial statement: describe the relationship (dependence) of the selected property of the studied objects from other properties. Functional statment: to find a functional dependence that approximately describes the change in the target attribute when other characteristics change.
- Recognition of images (classification with training). Substantial statement: find a rule, using which you can determine the belonging of any object to one of the issued images (object classes). Functional statement: find in the description space an area that separates a group of points corresponding to different images and describe it as a function of the original features; Find to which group of points (image) are the given objects
Thus, at the stage of qualitative data analysis, the object of research is data structure, and the result is information about the class of models that can be described by the phenomenon.
At the stage of the quantitative data analysis, there are parameters of the models created in the previous stage are searched. Comparative analysis helps to select the best options that have the right to exist, not only as formal results of experimentation, but also as meaningfully relevant information about the subject area.
That means there is a description of the created model in the formula language, the quantitative characteristics of the analyzed data are reflected. Very often there is a need to return to earlier stages of processing and repeating the entire research cycle.
At the stage of interpreting the results and making a decision, a decision is taken on the results of the data analysis:
- cessation of further processing, as previously set goals have been achieved;
- decision to continue processing data using other methods, possibly with data correction;
- decision on the lack of data or that the data does not contain sufficient information about the phenomenon being investigated. In this case, the analysis begins anew.
Thus: the success of data analysis depends not so much on the available methods, algorithms and processing systems as on the mastery of the methodology of their application.